


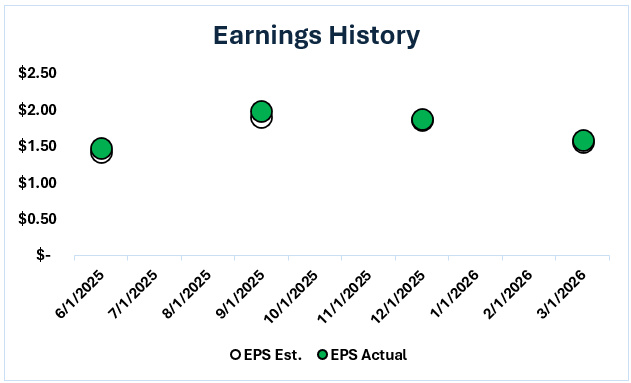
Procter & Gamble (P&G, A, Halal) reported fiscal third-quarter 2026 results that were stronger than analysts expected on both the top and bottom lines, despite a challenging global trade environment. Net sales grew 7% year-over-year to $21.2 billion, surpassing the market estimate of $20.57 billion. The Diluted Net EPS increased 6% to $1.63 in the recent PG earnings, although it is worth noting that this figure included an unusual gain from the spinoff of the Glad joint venture; however, even the Core EPS ($1.59) increased 3% and easily surpassed the market forecast of $1.56 (Investing).
Revenue Growth Drivers
The key driver of this quarter's growth was a shift in strategy from a price-led growth model to a volume-led one. For the first time in many quarters, P&G's organic sales volume contributed two-thirds of its 3% organic sales growth, suggesting that its "superiority" strategy (by investing in product quality rather than price increases) is succeeding in regaining market share from consumers who have traded down to private labels. Beauty was the growth driver, with a 7% rise in organic sales due to high-single-digit growth in premium Skin and Personal Care (Tradingview).
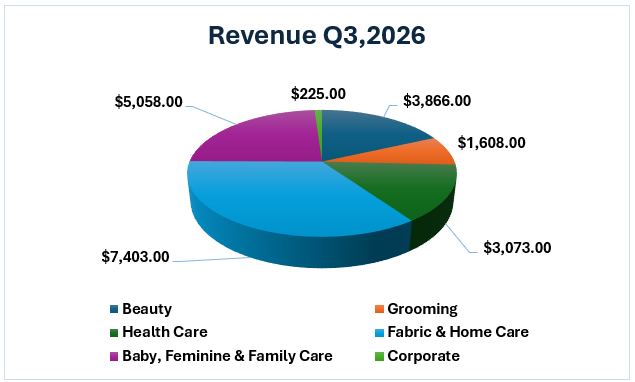
This performance in the PG Q3 results was supported by the "reinvention" of the China business model, in which P&G has redefined its market strategy to compete with indigenous brands. In the 3% growth Fabric & Home Care segment, P&G ran a "liquid intervention" marketing campaign for Tide, which led to increased unit volume in the US. At the same time, Baby, Feminine & Family Care grew 3%, driven by a strong volume rebound in emerging markets (such as the Middle East and India) and a recovery from retailer inventory cuts that had affected last year's performance.
Key Positive Takeaway
Beyond the top-line results, there were several operational and shareholder-focused events that highlight the company's strength for the long haul.
1.This quarter, P&G delivered 210 basis points in gross productivity gains through automation in manufacturing and the supply chain (Tradingview). This was essential in allowing the company to continue to be profitable while boosting marketing spending to combat the competition.
2. A key focus of the report was a 3% P&G dividend raise. This represents 70 consecutive years of annual dividend increases and 136 consecutive years of dividend payments, cementing P&G's status as a "Dividend King" and a stalwart among "defensive" investors (PG).
3.P&G recorded a strong 82% adjusted free cash flow productivity, with $3.0 billion in free cash flow. This has allowed them to return $3.2 billion to shareholders in the form of dividends and $600 million in stock buybacks (Stocktitan).
Expectations and Main Risks
Shaping the PG stock forecast, Procter & Gamble (P&G) has kept its 2016 full-year forecasts, but management has significantly lowered expectations by flagging that the company is likely to fall at the lower end of its guidance (0% to 4% for Core EPS). There are three reasons for this warning:
1.P&G is now facing a $400 million (after-tax) headwind from fresh tariffs, which is now eroding the gains from its productivity initiatives (PG).
2.While commodity costs were cooling, they have now surged, adding a further $150 million to their headwind for the rest of the year (Fool).
3.Although Greater China grew by 3%, the Chinese market is still sensitive. P&G stated that to sustain this growth, additional "merchandising investments" (discounts) are needed, which may negatively impact operating margins in the fourth quarter.
Sources

Disclaimer: This content is provided for informational purposes only and does not constitute investment, legal, tax, or financial advice, nor a recommendation to buy or sell any security. It is not tailored to your financial situation, risk tolerance, or investment objectives. Past performance does not guarantee future results, and all investing involves risk, including loss of principal. All opinions, analyses, forecasts, and estimates reflect the author’s views as of the publication date and may change without notice. Market conditions can change rapidly.
Stock screenings, Halal status, ratings, and classifications are based on AAOIFI standards and the oversight of Musaffa’s Shariah scholars and may change over time. Musaffa Islamic Socially Responsible Investing (MISRI) rankings are proprietary, may be in beta, and are not guaranteed to be accurate or complete.
Musaffa is a registered investment advisor (RIA) but is not a broker or dealer. Registration does not imply endorsement by the SEC. Musaffa does not execute or solicit securities transactions. Analysts may be internal or third-party contributors and are not necessarily licensed or certified to provide any professional advice.
Information is provided “as is” and may be sourced from third parties. Musaffa does not guarantee accuracy, completeness, or timeliness and is not responsible for errors or third-party content. Logos and trademarks are used for identification only and do not imply endorsement.
Readers should conduct their own research and consult qualified financial and/or religious advisors before making any decisions. For further details, please refer to the General Disclaimer.
Analyst’s Disclosure: I/we hold no positions in any securities mentioned and have no plans to initiate any within the next 72 hours. This article reflects my own opinions, for which I receive no compensation other than from Musaffa. I have no business relationship with any company mentioned.

 Foziljon Kamolitdinov
 Nusrat Ahmed